Beyond Point Predictions: A Practical Introduction to Bayesian Neural Networks
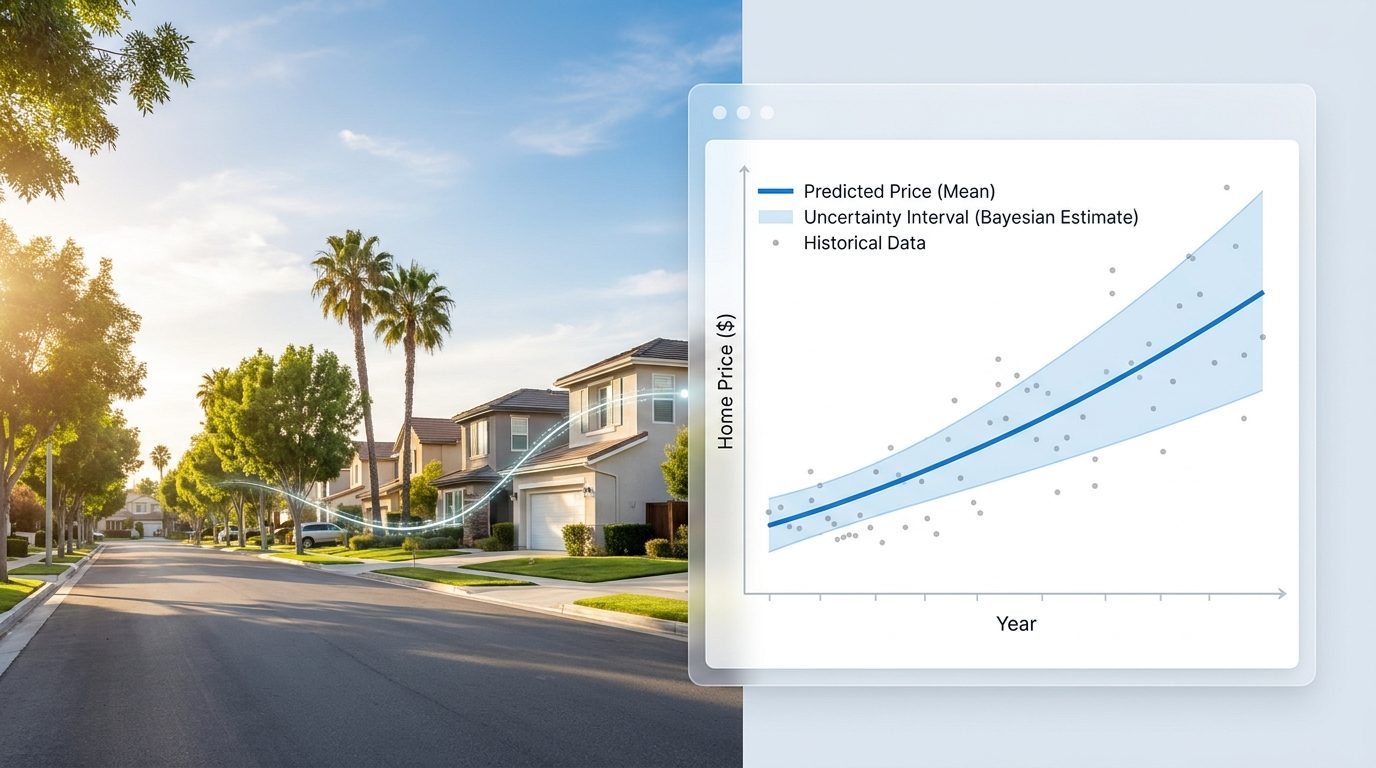
Beyond Point Predictions: A Practical Introduction to Bayesian Neural Networks More informed decision-making through uncertainty quantification The problem with point estimates When a machine learning model estimates the median value of a house in California, it usually hands you a single number: $385,000. That number may look precise. But hiding behind that estimate is uncertainty, and that uncertainty can arise from a variety of factors. Is the prediction uncertain because the neighborhood features are inherently noisy, or because the model has simply never seen a location quite like this one? Standard neural networks outputting single numbers cannot answer these questions. They will report error metrics, such as mean absolute error (MAE). Yet, this is just an average across a test dataset. MAE tells me nothing about the specific house I’m looking at right now. Adopting a Bayesian framework allows us to move from asking "What is the predicted home value?" to "What is the range of plausible values, and how sure are we?" Several recent Towards Data Science articles, such as Bayesian Guardrails for AI Decisions, have made excellent cases for considering uncertainty in automated decision-making. In this article, we’ll walk through a practical implementation and the engineering decisions it entails. Specifically, we'll be constructing a Bayesian Neural Network using Python and the California Housing dataset. You will learn how to parameterize weight distributions, run variational inference, and extract actionable uncertainty bounds that reveal exactly when your model should and shouldn't be trusted. Ideally, we’d like to plug some numbers into Bayes' theorem and compute the exact solution for our neural network. Unfortunately, this exact calculation is computationally intractable. A neural network with even a few thousand parameters creates a math problem that can be solved in theory but takes way too much time or memory to be useful in practice. As a result, implementing a Bayesian Neural Network leaves us with several design choices and training strategies. This article is focused on understanding those choices and how to implement them. Our shared Python notebooks are not optimized for network layer size or other hyperparameters. Rather, they are intended to highlight the engineering challenges involved in Bayesian Neural Network implementation. For illustrative purposes, each notebook highlights one specific design choice. A production system should include combinations of these choices. Uncertainty Quantification Before getting into the data and code, we need to further explore uncertainty quantification, as not all uncertainty is created equal. Philosophically, there are two broad types of uncertainty that have been discussed since the 17th century. Epistemic uncertainty is generally presented in terms of model uncertainty. We may be asking for a prediction on a home with features our model has never seen before. Conversely, aleatoric uncertainty is commonly presented as uncertainty from natural variability. Our model has seen plenty of houses like this one. Yet, the value of those similar homes is volatile, and our model is uncertain what to predict. Distinguishing between these two types of uncertainty is useful in practice, and there are mathematical formalisms that claim to separate aleatoric from epistemic uncertainty. Yet, the research literature has ended up with multiple mathematical definitions for the same philosophical concepts, and in some cases, conflicting definitions for the same concept. Current research is pointing us toward the unfortunate realization that aleatoric and epistemic uncertainty are mathematically intertwined in much of machine learning. The blog post Reexamining the Aleatoric and Epistemic Uncertainty Dichotomy has an excellent deep dive into this issue. For this article, we’ll restrict ourselves to a single uncertainty estimator without the specific labeling of aleatoric and epistemic. Dataset Overview: California Housing The California Housing Dataset in scikit-learn (BSD license) originated from the work of Pace and Barry (1997). It’s worth noting that the data was derived from the 1990 U.S. census and the house prices we’ll discuss do not reflect today’s market. If only we could still purchase beachfront property for the prices in this dataset! Each row in the dataset contains a summary of a census block group, which is the smallest geographical unit for which the U.S. Census Bureau samples data and consists of geographic areas of a few hundred to a few thousand people. The dataset contains the following eight features from 20,640 California homes. Feature | Description | MedInc | median income in block group | HouseAge | median house age in block group | AveRooms | average number of rooms per household | AveBedrms | average number of bedrooms per household | Population | block group population | AveOccup | average number of household members | Latitude | block group latitude | Longitude | block group longitude | Our target variable is the median house value for each California census block. The dataset arbitrarily sets all prices above $500,000 to $500,000 so we removed all homes at $500,000 to help the network learn. This notebook contains our pre-processing and creation of training and testing data. Comparison of traditional neural networks and Bayesian neural networks A standard neural network is essentially a massive machine with millions of tiny knobs called weights. Each weight controls how much one piece of information influences the final answer. In supervised learning, a network is given inputs and known outputs; the neural network makes predictions and looks at how far off each prediction is. It goes back through all those millions of knobs and slightly adjusts them so that, next time, the answer is a little closer to the correct answer. A standard network gives us a single, firm answer. It doesn’t know how to say “I don’t know.” Structurally, a Bayesian Neural Network (BNN) looks similar to a standard neural network. It has inputs, layers, and outputs. But there is a fundamental difference in how it works. In a BNN, each point estimate weight is replaced with a probability distribution. Typically, it’s a Gaussian distribution (the famous bell curve), but there’s no reason we couldn’t use a different distribution. Instead of a weight being set to exactly “5.2,” the weight is now a range of possibilities (the probability distribution). It might say, “The value is probably around 5, but it could be anywhere between 3 and 7.” Some weight distributions will become very tall and thin (high certainty). Others will be short and wide (low certainty). Once a traditional neural network is finished training, the weights are set, and the same input will always lead to the same output. However, the BNN behaves differently. It works via sampling. Each pass through the network draws a plausible value from each of the weight distributions. Why does this matter? Because it allows us to create prediction intervals. If one of our California homes is passed through the network multiple times, each pass will result in slightly different predictions because different weight values were chosen for each pass. This collection of predictions can be used to create an interval of probable home values. While a standard network would say “The median home value in this census block is $300,000,” a BNN can say, “We are 95% confident the median home value is between is $250,000 and $350,000”. This creates a layer of transparency critical for uncertainty quantification and decision-making. To make a neural network Bayesian, Bayes’ Rule requires us to calculate the posterior distribution of the weights given our training data: However, there’s a major catch. Calculating the denominator - what statisticians call the marginal likelihood - requires integrating over every conceivable combination of weights in the network. For a network with thousands or millions of parameters, this integral is mathematically intractable. We cannot compute the exact answer. So, how do we get around this? One way is to reframe the problem using Variational Inference (VI). Variational inference turns our calculations into an optimization problem. Instead of asking, "What is the true probability distribution?" it asks, "Can we find a simpler distribution that looks as much like the true one as possible?" The key insight is that optimization is often much easier than exact inference. Over the past several decades, researchers have developed powerful algorithms for finding the best solution to optimization problems, even when there are millions of variables. Variational inference takes advantage of these tools, allowing us to approximate probability distributions that would otherwise be out of reach. Ok, so we’ve decided to use variational inference. How do we know whether our approximation is any good? One of the most widely used measures is the Kullback-Leibler divergence, usually shortened to KL divergence. If two distributions are identical, their KL divergence is zero. As they become more different, the KL divergence grows larger. In variational inference, we imagine that the true probability distribution is the one we would like to know, while our variational distribution is our approximation. The KL divergence tells us how much our approximation differs from the ideal answer. Unfortunately, there's a major problem. To compute the KL divergence, we would need to know the very probability distribution we are trying to approximate. Fortunately, there’s an elegant workaround. Instead of working with KL divergence directly, we maximize another quantity called the Evidence Lower Bound, or ELBO. The ELBO is a score that can be computed using only the information available to us, and maximizing the ELBO is mathematically equivalent to minimizing the KL divergence. In other words, although we cannot know the true answer di
Comments
No comments yet. Start the discussion.